Multi-fractal Detrended Fluctuation Analysis
Usage
fd_mfdfa(
  y,
  fs = NULL,
  removeTrend = c("no", "poly", "adaptive", "bridge")[2],
  polyOrder = 1,
  standardise = c("none", "mean.sd", "median.mad")[1],
  adjustSumOrder = FALSE,
  removeTrendSegment = c("no", "poly", "adaptive", "bridge")[2],
  polyOrderSegment = 1,
  scaleMin = 16,
  scaleMax = stats::nextn(floor(NROW(y)/4), factors = 2),
  scaleResolution = round(log2(scaleMax - scaleMin)),
  scaleS = NA,
  overlap = NA,
  qq = seq(-5, 5, length.out = 101),
  doPlot = FALSE,
  returnPlot = FALSE,
  returnInfo = FALSE,
  silent = FALSE
)
Arguments
- y
A numeric vector or time series object.
- fs
Sample rate
- removeTrend
Method to use for global detrending (default =
"poly")- polyOrder
Order of global polynomial trend to remove if
removeTrend = "poly". IfremoveTrend = "adaptive"polynomials1topolyOrderwill be evaluated and the best fitting curve (R squared) will be removed (default =1)- standardise
Standardise the series using
ts_standardise()withadjustN = FALSE(default = "mean.sd")- adjustSumOrder
Adjust the time series (summation or difference), based on the global scaling exponent, see e.g. Ihlen (2012) (default =
FALSE)- removeTrendSegment
Method to use for detrending in the bins (default =
"poly")- polyOrderSegment
The DFA order, the order of polynomial trend to remove from the bin if
removeTrendSegment = "poly". IfremoveTrendSegment = "adaptive"polynomials1topolyOrderwill be evaluated and the best fitting polynomial (R squared) will be removed (default =1)- scaleMin
Minimum scale (in data points) to use for log-log regression (default =
4)- scaleMax
Maximum scale (in data points) to use for log-log regression (default =
stats::nextn(floor(NROW(y)/4), factors = 2))- scaleResolution
The scales at which detrended fluctuation will be evaluated are calculated as:
seq(scaleMin, scaleMax, length.out = scaleResolution)(default =round(log2(scaleMax-scaleMin))).- scaleS
If not
NA, it should be a numeric vector listing the scales on which to evaluate the detrended fluctuations. ArgumentsscaleMax, scaleMin, scaleResolutionwill be ignored (default =NA)- overlap
A number in
[0 ... 1]representing the amount of 'bin overlap' when calculating the fluctuation. This reduces impact of arbitrary time series begin and end points. Iflength(y) = 1024and overlap is.5, a scale of4will be considered a sliding window of size4with step-sizefloor(.5 * 4) = 2, so for scale128step-size will be64(default =NA)A vector containing a range of values for the order of fluctuation
q(default =seq(-5, 5,length.out=101))- doPlot
Output the log-log scale versus fluctuation plot with linear fit by calling function
plotFD_loglog()(default =TRUE)- returnPlot
Return ggplot2 object (default =
FALSE)- returnInfo
Return all the data used in SDA (default =
FALSE)- silent
Silent-ish mode (default =
FALSE)
Examples
set.seed(33)
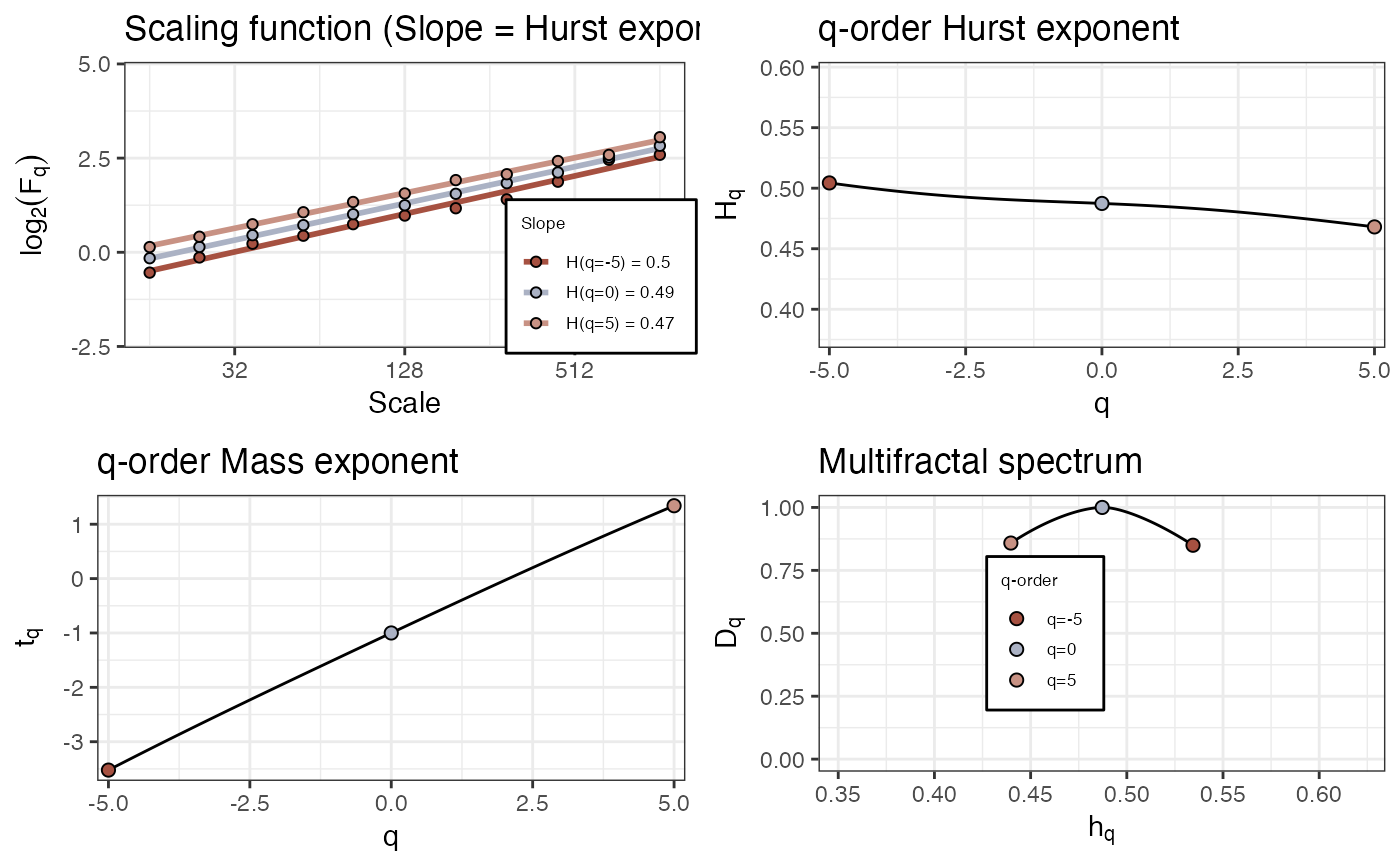
# White noise
fd_mfdfa(rnorm(4096), doPlot = TRUE)
#>
#>
#> (mf)dfa: Sample rate was set to 1.
#>
#> `geom_smooth()` using formula = 'y ~ x'
 #>
#> ~~~o~~o~~casnet~~o~~o~~~
#>
#> Multifractal Detrended FLuctuation Analysis
#>
#> Spec_AUC Spec_Width Spec_CVplus Spec_CVmin Spec_CVtot Spec_CVasymm
#> 1 0.0894 0.0947 0.0455 0.0466 0.0459 -0.0114
#>
#>
#> ~~~o~~o~~casnet~~o~~o~~~
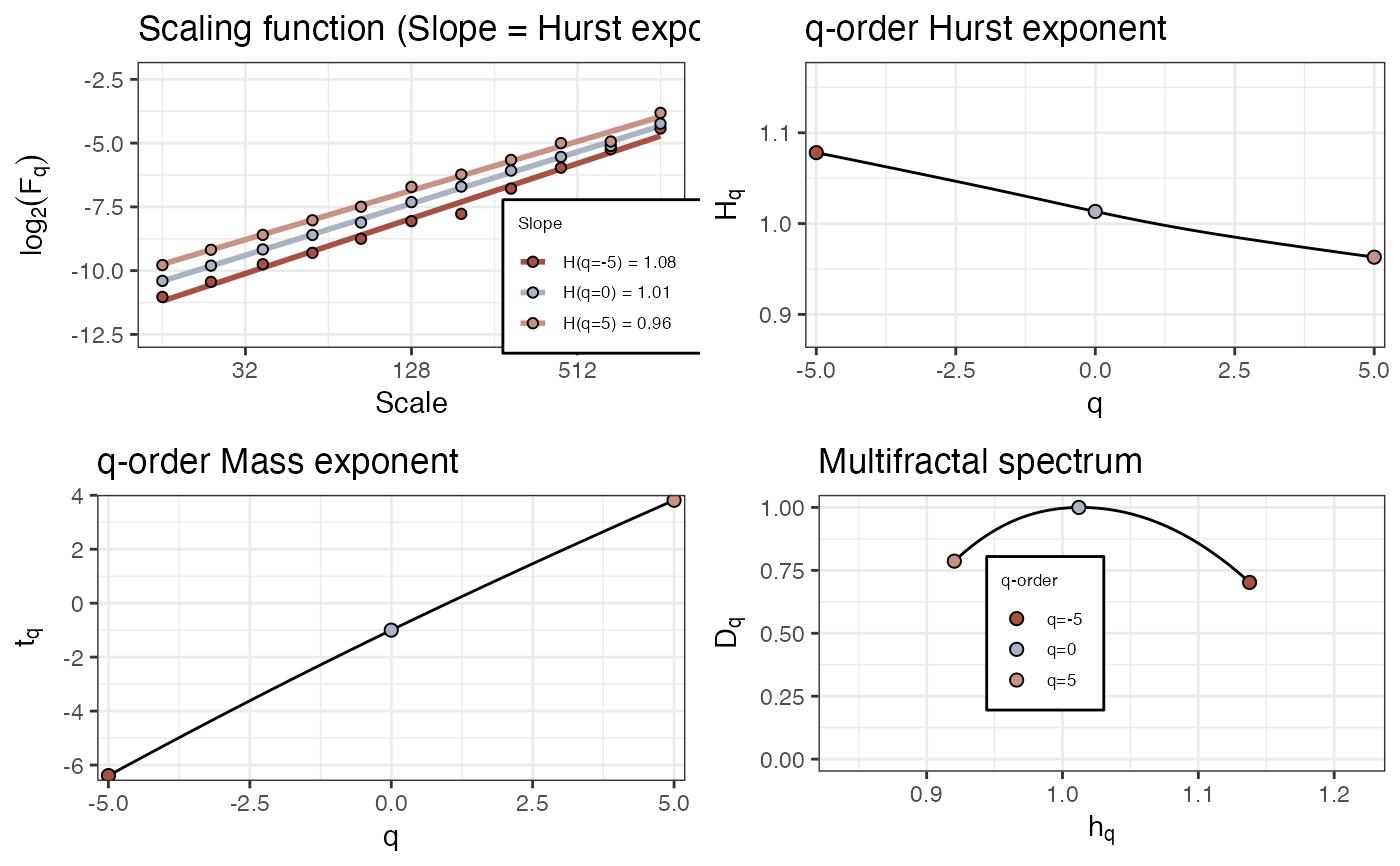
# Pink noise
fd_mfdfa(noise_powerlaw(N=4096), doPlot = TRUE)
#>
#>
#> (mf)dfa: Sample rate was set to 1.
#>
#> `geom_smooth()` using formula = 'y ~ x'
#>
#> ~~~o~~o~~casnet~~o~~o~~~
#>
#> Multifractal Detrended FLuctuation Analysis
#>
#> Spec_AUC Spec_Width Spec_CVplus Spec_CVmin Spec_CVtot Spec_CVasymm
#> 1 0.0894 0.0947 0.0455 0.0466 0.0459 -0.0114
#>
#>
#> ~~~o~~o~~casnet~~o~~o~~~
# Pink noise
fd_mfdfa(noise_powerlaw(N=4096), doPlot = TRUE)
#>
#>
#> (mf)dfa: Sample rate was set to 1.
#>
#> `geom_smooth()` using formula = 'y ~ x'
 #>
#> ~~~o~~o~~casnet~~o~~o~~~
#>
#> Multifractal Detrended FLuctuation Analysis
#>
#> Spec_AUC Spec_Width Spec_CVplus Spec_CVmin Spec_CVtot Spec_CVasymm
#> 1 0.199 0.217 0.0709 0.104 0.0892 -0.189
#>
#>
#> ~~~o~~o~~casnet~~o~~o~~~
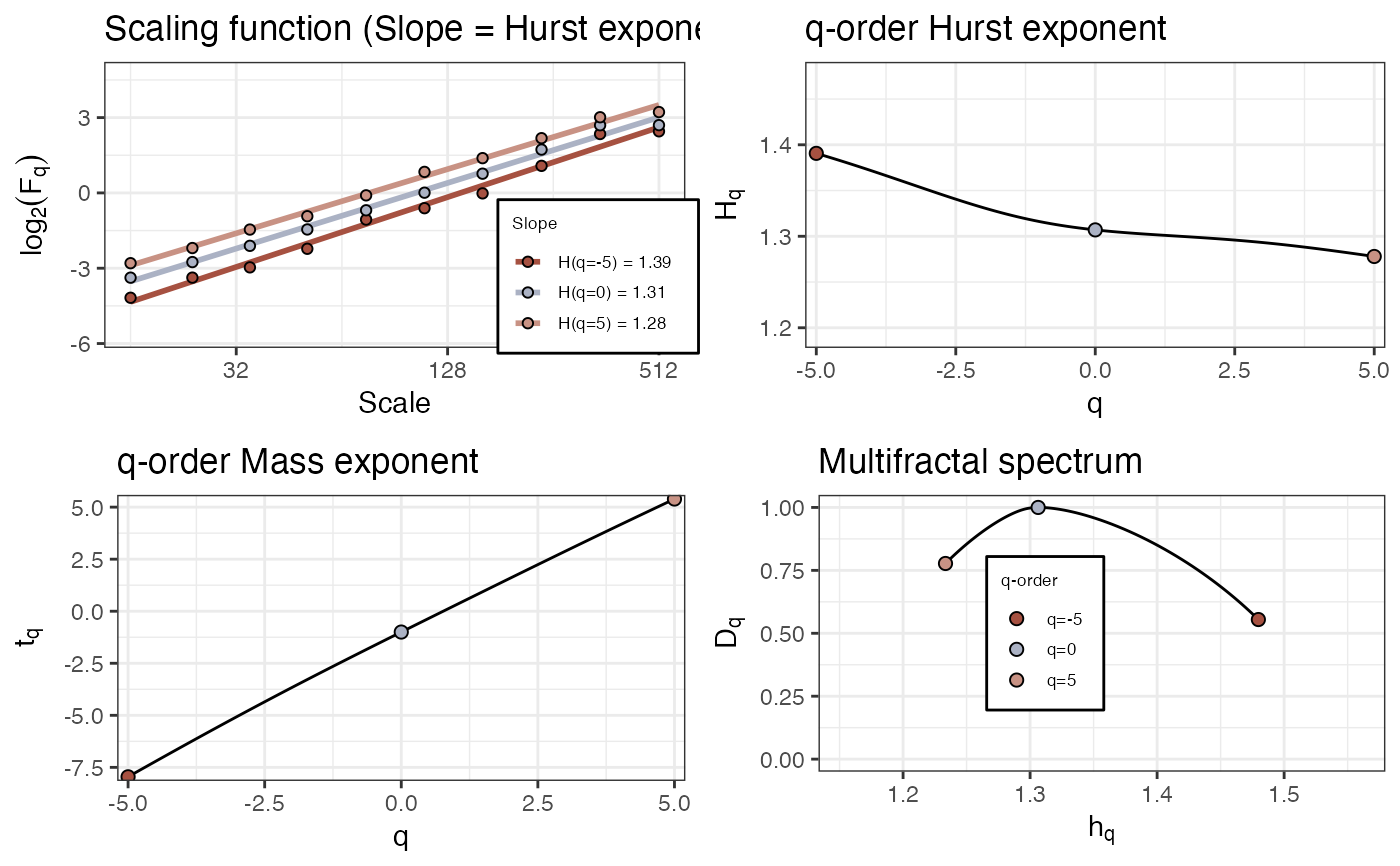
# 'multi' fractal
N <- 2048
y <- rowSums(data.frame(elascer(noise_powerlaw(N=N, alpha = -2)), elascer(noise_powerlaw(N=N, alpha = -.5))*c(rep(.2,512),rep(.5,512),rep(.7,512),rep(1,512))))
fd_mfdfa(y=y, doPlot = TRUE)
#>
#>
#> (mf)dfa: Sample rate was set to 1.
#>
#> `geom_smooth()` using formula = 'y ~ x'
#>
#> ~~~o~~o~~casnet~~o~~o~~~
#>
#> Multifractal Detrended FLuctuation Analysis
#>
#> Spec_AUC Spec_Width Spec_CVplus Spec_CVmin Spec_CVtot Spec_CVasymm
#> 1 0.199 0.217 0.0709 0.104 0.0892 -0.189
#>
#>
#> ~~~o~~o~~casnet~~o~~o~~~
# 'multi' fractal
N <- 2048
y <- rowSums(data.frame(elascer(noise_powerlaw(N=N, alpha = -2)), elascer(noise_powerlaw(N=N, alpha = -.5))*c(rep(.2,512),rep(.5,512),rep(.7,512),rep(1,512))))
fd_mfdfa(y=y, doPlot = TRUE)
#>
#>
#> (mf)dfa: Sample rate was set to 1.
#>
#> `geom_smooth()` using formula = 'y ~ x'
 #>
#> ~~~o~~o~~casnet~~o~~o~~~
#>
#> Multifractal Detrended FLuctuation Analysis
#>
#> Spec_AUC Spec_Width Spec_CVplus Spec_CVmin Spec_CVtot Spec_CVasymm
#> 1 0.212 0.246 0.0732 0.176 0.14 -0.412
#>
#>
#> ~~~o~~o~~casnet~~o~~o~~~
#>
#> ~~~o~~o~~casnet~~o~~o~~~
#>
#> Multifractal Detrended FLuctuation Analysis
#>
#> Spec_AUC Spec_Width Spec_CVplus Spec_CVmin Spec_CVtot Spec_CVasymm
#> 1 0.212 0.246 0.0732 0.176 0.14 -0.412
#>
#>
#> ~~~o~~o~~casnet~~o~~o~~~