Create transition network
Usage
rn_transition(
  phaseSequence,
  threshold = NA,
  doMatrixPlot = TRUE,
  doNetworkPlot = TRUE,
  excludeOther = FALSE,
  excludeNorec = TRUE,
  returnGraph = FALSE
)
Arguments
- phaseSequence
A vector with names or numbers that represent a sequence of phases or order parameter dynamics. If a named numeric vector is passed, the names attribute will be used to represent the phases. If the variable
phase_name, generated by rn_phases is used, the argumentsexcludeOtherandexcludeNorecwil be evaluated.- threshold
Provide a threshold for the relative frequencies. Values below the threshold will be set to
0. PassNAto not use a threshold (default =NA)- doMatrixPlot
default(
TRUE)- doNetworkPlot
default(
TRUE)- excludeOther
Should the phase "Other" be excluded from plots? (default =
FALSE)- excludeNorec
Should the category "No recurrence" be excluded from plots? (default =
TRUE)- returnGraph
Return an
igraph::igraph()object (default =FALSE)
Examples
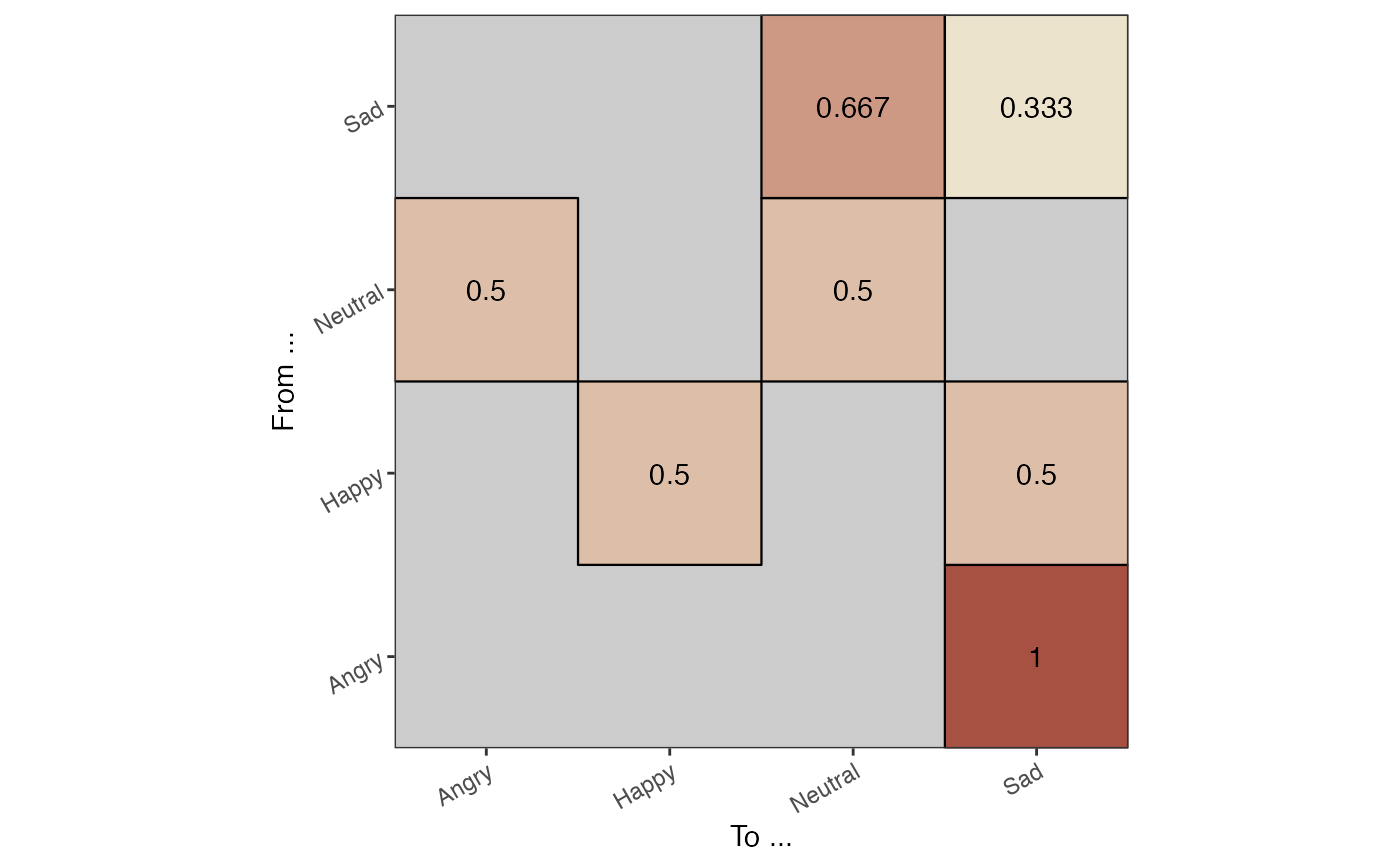
# This will output the transition matrix, a plot of the matrix and a transition network plot.
y <- c("Happy", "Happy", "Sad", "Neutral", "Neutral", "Angry", "Sad", "Sad", "Neutral")
TM <- rn_transition(y)

#> Warning: longer argument not a multiple of length of shorter
#> Warning: longer argument not a multiple of length of shorter
#> Warning: longer argument not a multiple of length of shorter
#> Warning: longer argument not a multiple of length of shorter
#> Warning: longer argument not a multiple of length of shorter
#> Warning: longer argument not a multiple of length of shorter
#> Warning: longer argument not a multiple of length of shorter
#> Warning: longer argument not a multiple of length of shorter
#> Warning: longer argument not a multiple of length of shorter
#> Warning: longer argument not a multiple of length of shorter
#> Warning: longer argument not a multiple of length of shorter
#> Warning: longer argument not a multiple of length of shorter
#> Warning: longer argument not a multiple of length of shorter
#> Warning: longer argument not a multiple of length of shorter
#> Warning: longer argument not a multiple of length of shorter
#> Warning: longer argument not a multiple of length of shorter
#> Warning: longer argument not a multiple of length of shorter
#> Warning: longer argument not a multiple of length of shorter
#> Warning: longer argument not a multiple of length of shorter
#> Warning: longer argument not a multiple of length of shorter
#> Warning: longer argument not a multiple of length of shorter