THIS IS THE OLDER VERSION OF THE FUNCTION KEPT FOR BACKWARD COMPATIBILITY
Usage
rn_phases(
  RN,
  maxPhases = NA,
  minStatesinPhase = 2,
  maxStatesinPhase = NROW(RN),
  useDegree = FALSE,
  inverseWeight = TRUE,
  cleanUp = TRUE,
  returnCentroid = c("no", "mean.sd", "median.mad", "centroid")[1],
  removeSingularities = FALSE,
  standardise = c("none", "mean.sd", "median.mad", "unit")[4],
  returnGraph = FALSE,
  doPhaseProfilePlot = FALSE,
  plotCentroid = FALSE,
  dimNames = NULL,
  colOrder = FALSE,
  phaseColours = NULL,
  doSpiralPlot = FALSE,
  doPhaseSeriesPlot = FALSE,
  doPhaseSpacePojectionPlot = FALSE,
  showEpochLegend = TRUE,
  epochColours = NULL,
  epochLabel = "Phase",
  excludeOther = FALSE,
  excludeNorec = TRUE
)
Arguments
- RN
A matrix produced by the function rn
- maxPhases
The maximum number of phases to extract. These will be the phases associated with the highest node degree or node strength. All other recurrent points will be labelled with "Other". If
NA, the value will be set toNROW(RN), this will return all the potential phases in the data irrespective of their frequency/strength of recurrence (default =10)- minStatesinPhase
A parameter applied after the extraction of phases (limited by
maxPhases). If any extracted phases do not have a minimum number ofminStatesinPhase+1(= the state that was selected based on node strength), the phase will be removed from the result (default =1)- maxStatesinPhase
A parameter applied after the extraction of phases (limited by
maxPhases). If any extracted phases exceeds a maximum number ofmaxStatesinPhase+1(= the state that was selected based on node strength), the phase will be removed from the result (default =NROW(RN))- useDegree
By default, node strength will be used to determine the phases. Set to
TRUEto use the node degree (default =FALSE)- inverseWeight
Whether to perform the operation
1/weighton the edge weights. The default isTRUE, if the matrix was weighted by a distance metric (weightedBy = "si") edges with smaller distances (recurring coordinates closer to the current coordinate) have greater impact on the node strength calculation used to select the phases. If the matrix was weighted by recurrence time (weightedBy = "rt") andinverseWeight = TRUE, recurrent points with shorter recurrence times will have greater impact on the strength calculation. IfweightedBy = "rf", lower frequencies will end up having more impact. (default =TRUE)- cleanUp
Try to assign states to phases that were not assigned by the algorithm. If
FALSE, these states will be added to category "Other" (default =TRUE)- returnCentroid
Values can be
"no","mean.sd","median.mad","centroid". Any other value than"no"will return a data frame with the central tendency and deviation measures for each phase (default ="no")- removeSingularities
Will remove states that recur only once (nodes with
degree(g) == 1) (default =FALSE)- standardise
Standardise the series using
ts_standardise()withadjustN = FALSE(default = "mean.sd")- returnGraph
Returns all the graph object objects of the plots that have been produced (default =
FALSE)- doPhaseProfilePlot
Produce a profile plot of the extracted phases (default =
TRUE)- plotCentroid
Plot the centroid requested in
returnCentroid? (default =FALSE)- dimNames
A vector of titles to use for the dimensions. If
NULLthe values will be read from the attribute ofRN.- colOrder
Should the order of the dimensions reflect the order of the columns in the dataset? If
FALSEthe order will be based on the values of the dimensions observed in the first extracted phase (default =FALSE)- phaseColours
Colours for the different phases in the phase plot. If
epochColoursalso has a value,phaseColourswill be used instead (default =NULL)- doSpiralPlot
Produce a plot of the recurrence network with the nodes coloured by phases (default =
FALSE)- doPhaseSeriesPlot
Produce a time series of the phases as they occur with a marginal histogram of their frequency (default =
FALSE)- showEpochLegend
Should a legend be shown for the epoch colours? (default =
TRUE)- epochColours
A vector of length
vcount(g)with colour codes (default =NULL)- epochLabel
A title for the epoch legend (default =
"Epoch")- excludeOther
Should the phase "Other" be excluded from plots? (default =
FALSE)- excludeNorec
Should the category "No recurrence" be excluded from plots? (default =
TRUE)- doPhaseSpaceProjectionPlot
produce a 2D
umapprojection of the phases (default =FALSE)
Value
A data frame with information about the phases or a list object with data and graph objects (if requested).
Details
This function will extract phases (regions of attraction in phase space) based on a weighted RN object created with function rn.
The assumption is that coordinates in state space that are either close in terms of distance, or are re-visited with short recurrence times,
or with high-frequency, are regions of attraction for the system.
The method used for the identification of phases is on the properties of the RN object:
If weighted by distance
"si", the inverse distance will be used, which means higher weights correspond to closer states.If weighted by recurrence time
"rt", the inverse time will be used, which means higher weights correspond to faster recurrence times.
The procedure is as follows:
Identify the node with the highest strength
Identify the nodes that connect to this node
Identify the node with highest strength that does not connect to the node identified in step 1.
Repeat until criteria set in
maxPhases,minStatesinPhaseandmaxStatesinPhaseare triggered.Clean up. If
cleanUp = TRUEthe remaining states that connect to nodes of one of the identified phases, but not to the node with highest strength identified in step 1 will be added to that phase. Otherwise these nodes will end up in category "Other".
See also
Other Distance matrix operations (recurrence network):
mat_di2bi(),
mat_di2ch(),
mat_di2we(),
rn(),
rn_phaseInfo(),
rn_plot(),
rn_recSpec()
Examples
# Use the ManyAnalysts dataset to create a phase plot with default settings
data("manyAnalystsESM")
df <- manyAnalystsESM[4:10]
RN <- rn(y1 = df, doEmbed = FALSE, weighted = TRUE, weightedBy = "si", emRad = NA)
#> `emRad` was set to NA due to the value `weighted = TRUE`, if you want an unthresholded matrix set `weighted = FALSE`
# This returns 6 phases which have minimally 2 states
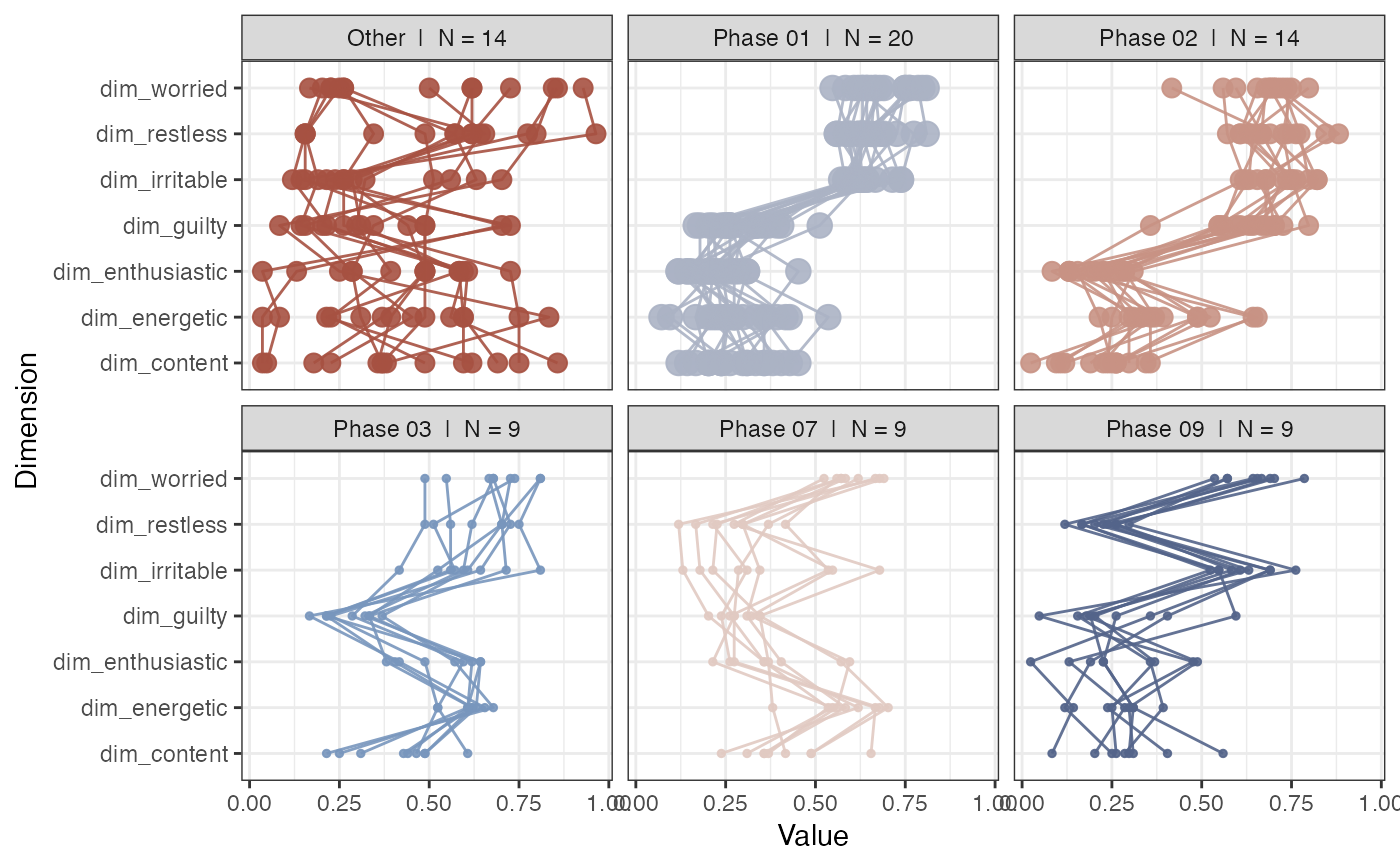
rn_phases(RN, maxPhases = 10, doPhaseProfilePlot = TRUE)
#> This function uses an old version of the phase search algorithm...
#> Use rn_phaseInfo(), the new algorithm will produce different results!
#>
#> maxPhases = 10. Any unassigned recurring states will be labelled as phase 'Other'
#>
#> Found 10 phases with at least 2 states.
#> Warning: no non-missing arguments to max; returning -Inf
#> Warning: no non-missing arguments to max; returning -Inf
 # Use min. number of states as the extraction criterion
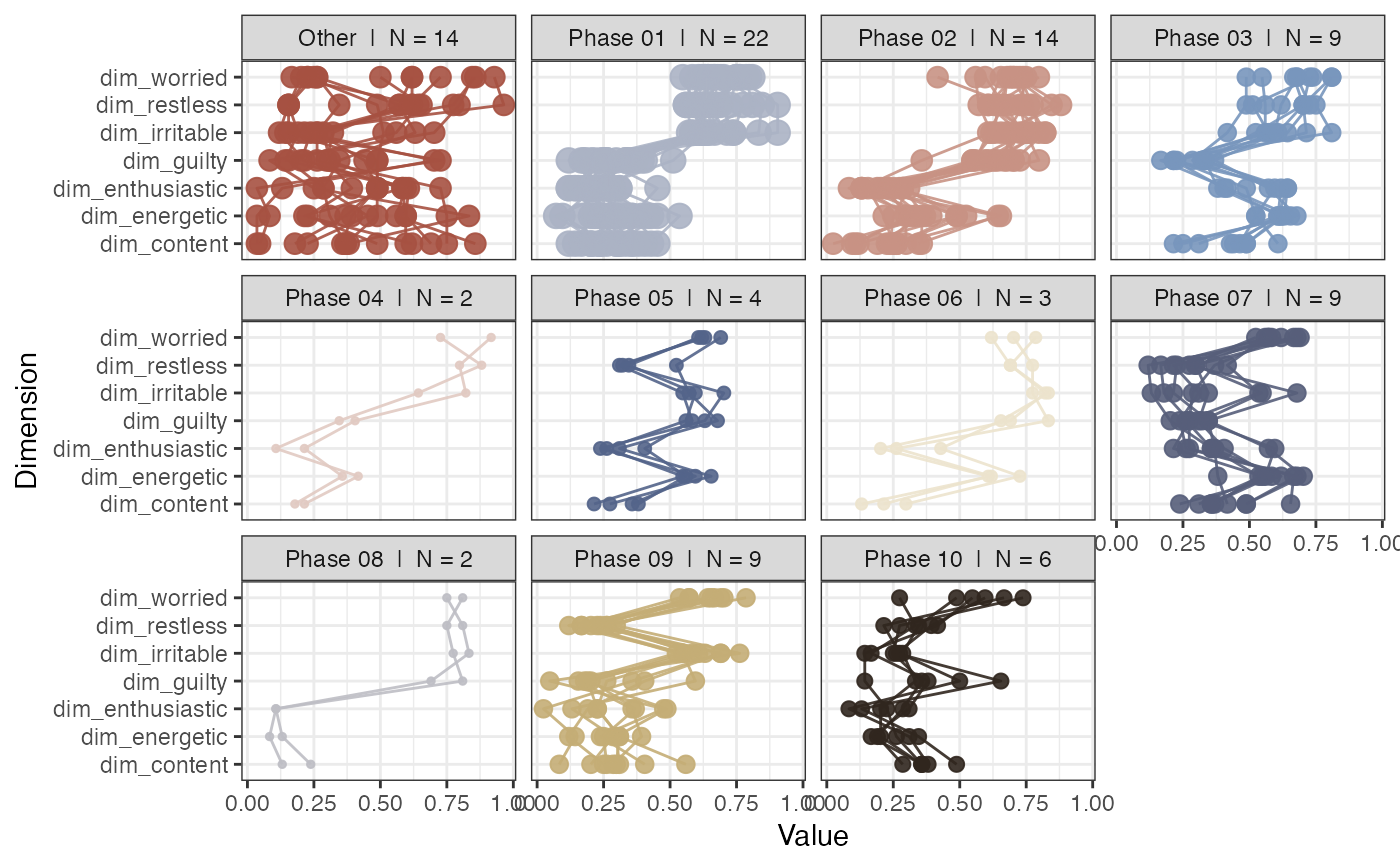
rn_phases(RN, maxPhases = NA, minStatesinPhase = 7, doPhaseProfilePlot = TRUE)
#> This function uses an old version of the phase search algorithm...
#> Use rn_phaseInfo(), the new algorithm will produce different results!
#>
#> Found 11 phases with at least 7 states.
#> Warning: no non-missing arguments to max; returning -Inf
#> Warning: no non-missing arguments to max; returning -Inf
# Use min. number of states as the extraction criterion
rn_phases(RN, maxPhases = NA, minStatesinPhase = 7, doPhaseProfilePlot = TRUE)
#> This function uses an old version of the phase search algorithm...
#> Use rn_phaseInfo(), the new algorithm will produce different results!
#>
#> Found 11 phases with at least 7 states.
#> Warning: no non-missing arguments to max; returning -Inf
#> Warning: no non-missing arguments to max; returning -Inf