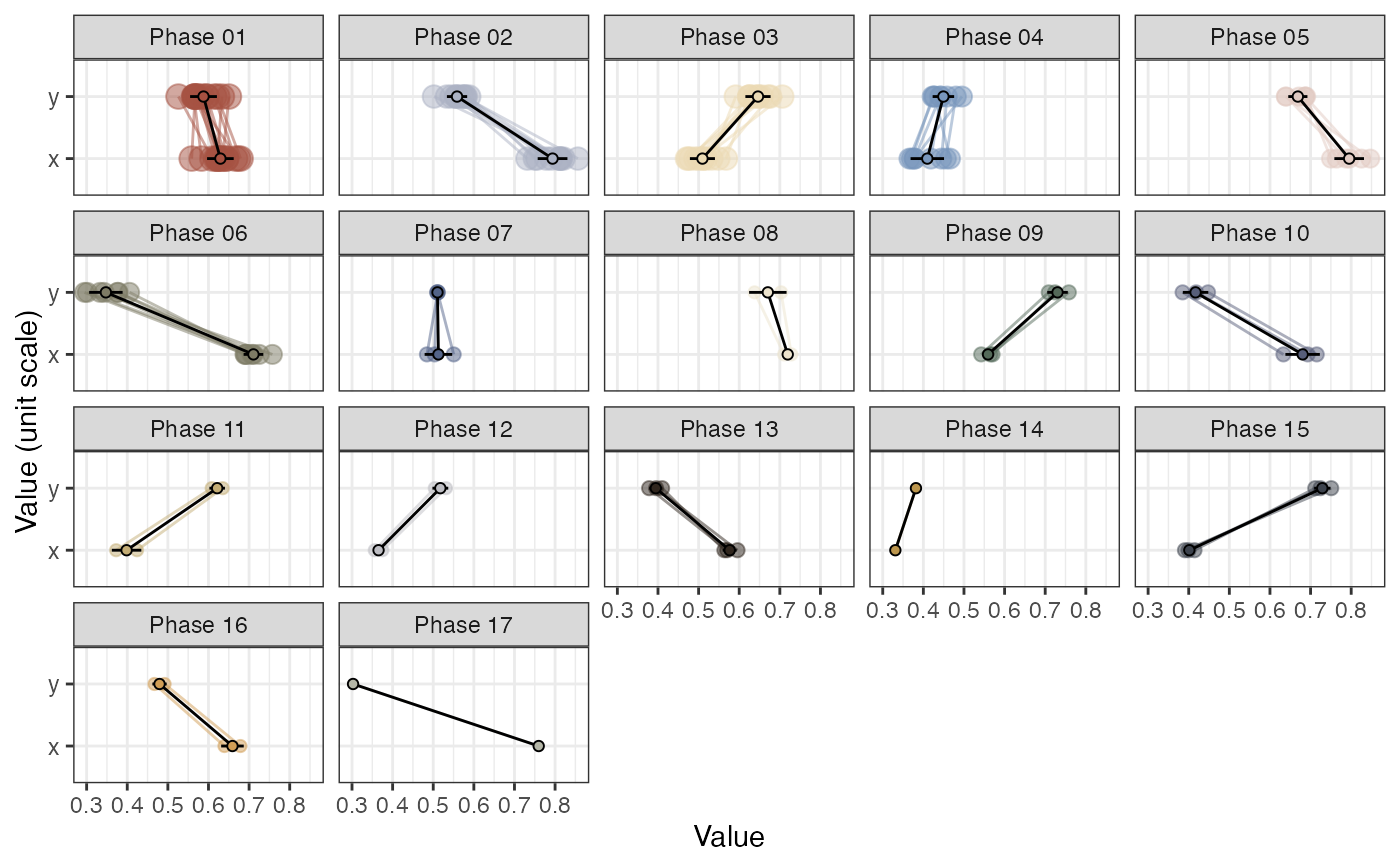
Plot a profile (values of the dimensions) for each phase.
Usage
plotRN_phaseProfiles(
  phaseOutput,
  plotCentroid = NA,
  showEpochLegend = TRUE,
  epochColours = NULL,
  epochLabel = "Phase",
  excludeTransients = FALSE,
  excludePhaseNeighbours = FALSE,
  excludeNonrecurring = TRUE,
  excludeSingularities = TRUE,
  excludeVars = "",
  excludePhases = "",
  showPhaseSize = TRUE,
  returnGraph = FALSE,
  colOrder = NA
)
Arguments
- phaseOutput
Output from function rn_phaseInfo
- excludeTransients
Should the category "Transient" be excluded from plots? (default =
FALSE)- excludeNonrecurring
Should the category "Nonrecurring" be excluded from plots? (default =
TRUE)- excludeSingularities
Should the category "Singularity" be excluded from plots? (default =
TRUE)- excludeVars
Exclude specific dimension variables by name. Leave empty to include all variables (default =
"")- excludePhases
Exclude Phases by their name (variable
phase_name). Leave empty to include all Phases (after the other exclusion arguments) (default ="")- showPhaseSize
Show the number of states in each phase in the labels (default = TRUE)
Examples
RN <- rn(y1 = data.frame(x = rnorm(100), y= rnorm(100)), weighted = TRUE)
#> `emRad` was set to NA due to the value `weighted = TRUE`, if you want an unthresholded matrix set `weighted = FALSE`
#> Set `weightedBy` to 'si' due to the value `weighted = TRUE`
phase_out <- rn_phaseInfo(RN, returnCentroid = "mean.sd")
#>
#> ~~~o~~o~~casnet~~o~~o~~~
#>
#> Recurring states with high similarity will be considered a phase
#>
#>
#> Looking for phases...
#> State at time 30 is template for phase 1
#> State at time 66 is template for phase 2
#> State at time 22 is template for phase 3
#> ...Found state(s) already assigned to a phase in a previous iteration step:
#> ...State at t=26 [Phase 01.7] | State at t=54 [Phase 01.9] | State at t=59 [Phase 01.11] | State at t=92 [Phase 01.15] >> will be labelled as Transient(s)
#>
#> State at time 7 is template for phase 4
#> State at time 32 is template for phase 5
#> ...Found state(s) already assigned to a phase in a previous iteration step:
#> ...State at t=58 [Phase 03.6] >> will be labelled as Transient(s)
#>
#> State at time 69 is template for phase 6
#> ...Found state(s) already assigned to a phase in a previous iteration step:
#> ...State at t=41 [Phase 02.4] | State at t=74 [Phase 02.8] | State at t=88 [Phase 02.9] | State at t=89 [Phase 02.10] >> will be labelled as Transient(s)
#>
#> State at time 67 is template for phase 7
#> ...Found state(s) already assigned to a phase in a previous iteration step:
#> ...State at t=4 [Phase 02.1] | State at t=12 [Phase 02.6] | State at t=63 [Phase 02.11] | State at t=95 [Phase 04.3] >> will be labelled as Transient(s)
#>
#> State at time 27 is template for phase 8
#> ...Found state(s) already assigned to a phase in a previous iteration step:
#> ...State at t=46 [Phase 05.4] | State at t=62 [Phase 05.6] | State at t=72 [Phase 06.2] >> will be labelled as Transient(s)
#>
#> State at time 3 is template for phase 9
#> State at time 34 is template for phase 10
#> ...Found state(s) already assigned to a phase in a previous iteration step:
#> ...State at t=46 [Phase 06.2] | State at t=49 [Phase 08.2] | State at t=80 [Phase 08.3] >> will be labelled as Transient(s)
#>
#> State at time 79 is template for phase 11
#> ...Found state(s) already assigned to a phase in a previous iteration step:
#> ...State at t=37 [Phase 03.3] | State at t=58 [Phase 03.6] | State at t=84 [Phase 05.7] >> will be labelled as Transient(s)
#>
#> State at time 78 is template for phase 12
#> State at time 94 is template for phase 13
#> ...Found state(s) already assigned to a phase in a previous iteration step:
#> ...State at t=21 [Phase 04.4] | State at t=42 [Phase 04.7] >> will be labelled as Transient(s)
#>
#> State at time 16 is template for phase 14
#> ...Found state(s) already assigned to a phase in a previous iteration step:
#> ...State at t=20 [Phase 02.2] >> will be labelled as Transient(s)
#>
#> State at time 19 is template for phase 15
#> State at time 35 is template for phase 16
#> State at time 44 is template for phase 17
#> State at time 48 is template for phase 18
#> ...Found state(s) already assigned to a phase in a previous iteration step:
#> ...State at t=5 [Phase 09.2] >> will be labelled as Transient(s)
#>
#>
#> Found 18 phases with at least 2 states.
plotRN_phaseProfiles(phaseOutput = phase_out)