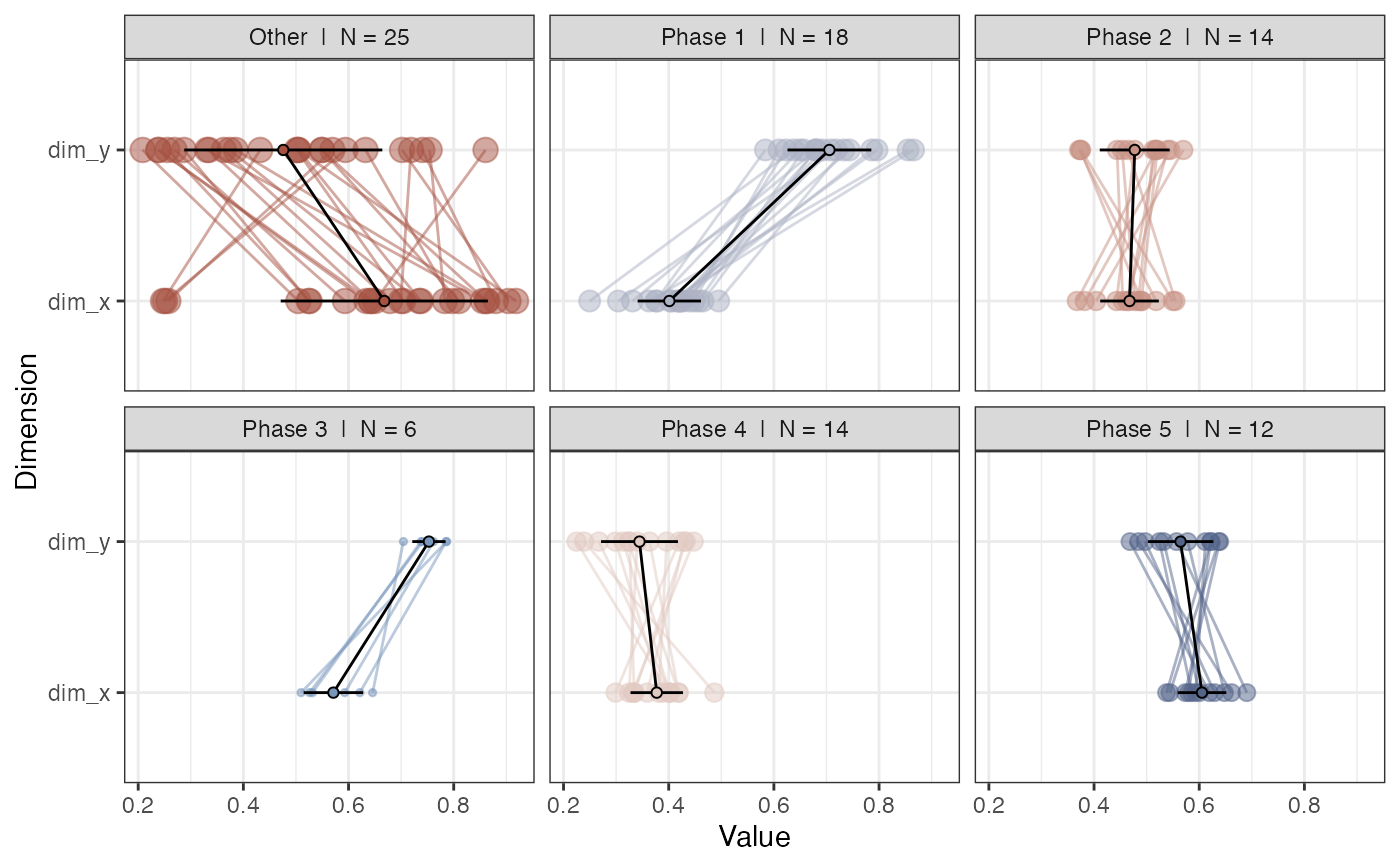
Plot a profile (values of the dimensions) for each phase.
Usage
plotRN_phaseProfile(
  phaseOutput,
  plotCentroid = NA,
  showEpochLegend = TRUE,
  epochColours = NULL,
  epochLabel = "Phase",
  excludeOther = FALSE,
  excludeNorec = TRUE,
  excludeVars = "",
  excludePhases = "",
  returnGraph = FALSE,
  colOrder = NA
)
Arguments
- phaseOutput
Output from function rn_phases
- excludeOther
Exclude the default Phase "Other"
- excludeNorec
Exclude the default Phase "No recurrence"
- excludeVars
Exclude specific dimension variables by name. Leave empty to include all variables (default =
"")- excludePhases
Exclude Phases by their name (variable
phase_name). Leave empty to include all Phases (afterexcludeOtherandexcludeNorec) (default ="")
Examples
RN <- rn(y1 = data.frame(x = rnorm(100), y= rnorm(100)), weighted = TRUE)
#> `emRad` was set to NA due to the value `weighted = TRUE`, if you want an unthresholded matrix set `weighted = FALSE`
#> Set `weightedBy` to 'si' due to the value `weighted = TRUE`
phase_out <- rn_phases(RN, returnCentroid = "mean.sd")
#> This function uses an old version of the phase search algorithm...
#> Use rn_phaseInfo(), the new algorithm will produce different results!
#>
#> Found 9 phases with at least 2 states.
#> Warning: no non-missing arguments to max; returning -Inf
#> Warning: no non-missing arguments to max; returning -Inf
plotRN_phaseProfile(phaseOutput = phase_out)