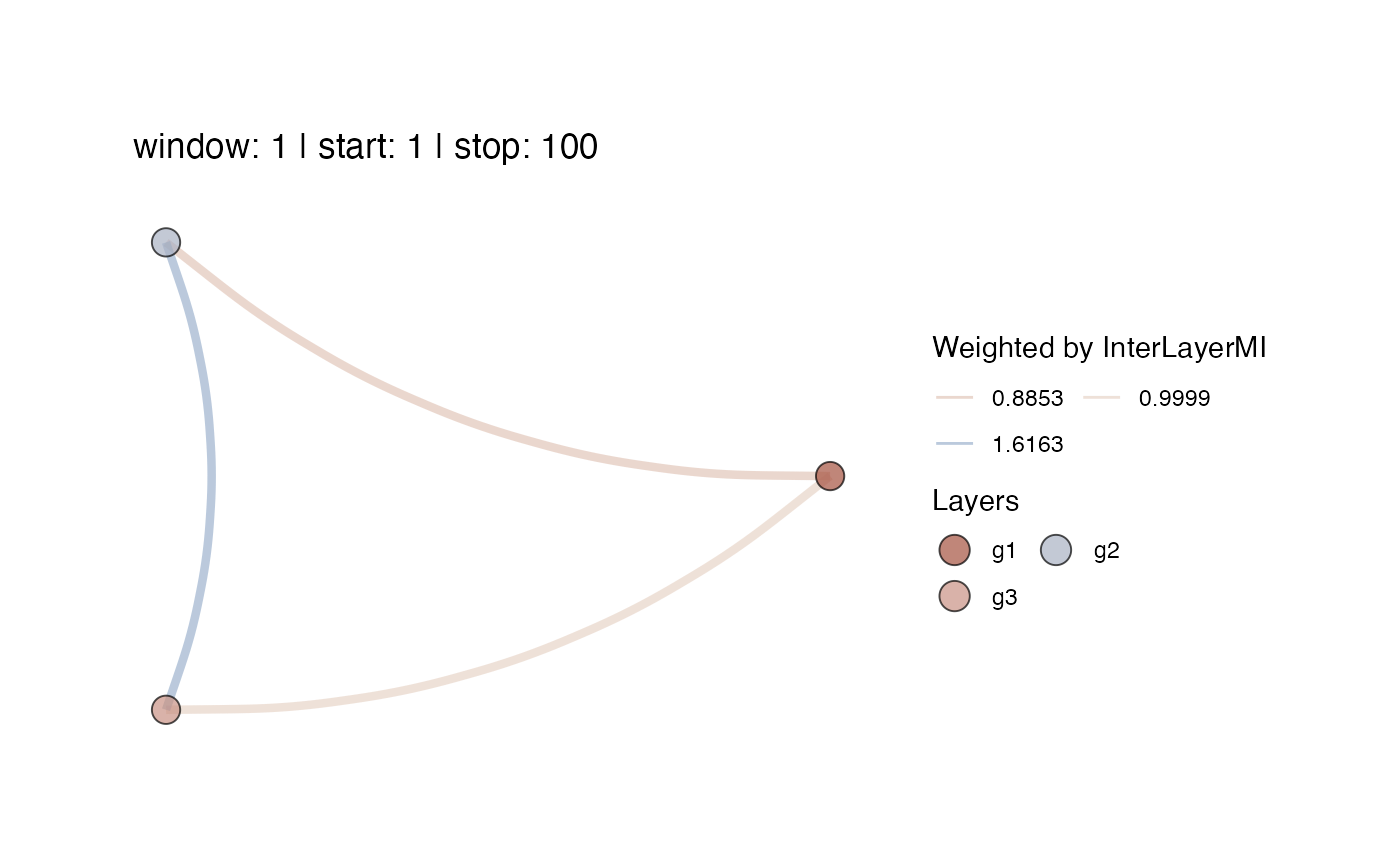
This function will plot a Multiplex Recurrence Network from a list of igraph objects that can be considered the layers of a network. or based on the output of function mrn(). The layers must have the same number of nodes.
Usage
mrn_plot(
  layers = NA,
  MRN = NA,
  MRNweightedBy = c("InterLayerMI", "EdgeOverlap")[1],
  win = NA,
  step = NA,
  overlap = NA,
  alignment = "r",
  cumulative = FALSE,
  doPlot = TRUE,
  doSave = FALSE,
  coords = NA,
  RNnodes = FALSE,
  vertexSizeBy = "degree",
  scaleVertexSize = c(0.01, 5),
  vertexColour = NA,
  vertexBorderColour = "black",
  showVertexLegend = TRUE,
  showSizeLegend = FALSE,
  alphaV = 0.7,
  scaleEdgeSize = 1/5,
  alphaE = 0.5,
  showEdgeColourLegend = FALSE,
  curvature = -0.2,
  title = "",
  createAnimation = FALSE,
  useImageMagick = FALSE,
  loopAnimation = TRUE,
  transitionLength = 3,
  stateLength = 1,
  gifWidth = 600,
  gifRes = 150,
  noParts = TRUE,
  imageDir = NA,
  silent = TRUE
)
Arguments
- layers
A list of igraph objects representing the layers of the multiplex network. The layer networks must all have the same number of vertices.
- MRN
The output from function
mrn()- MRNweightedBy
The measure to be used to evaluate the average structural similarities between the layers of the network. Valid options are:
"InterLayerMI"(Mutual information based on similarity of the vertex degree across layers),"EdgeOverlap"(proportion of vertices sharing the same edges across layers). Choosing"InterLayerMI"or"EdgeOverlap"will decide which measure is displayed in the plot of the Multiplex RN, both measures will always be returned in the numerical output.- win
The window size passed to
ts_windower()in which to evaluate"InterLayerMI","InterLayerCor","EdgeOvelap", or "JRP". (default =NA).- step
The stepsize for the sliding window (default =
NA).- overlap
The window overlap passed to
ts_windower()ifMRNweightedByis"InterLayerMI"or"EdgeOvelap". The value ofstepwill be ignored ifoverlapis notNA. (default =NA).- alignment
Whether to right (
"r"), center ("c"), or left ("l") align the window.- cumulative
To make the network represent cumulative time, set
directed = TRUEandcumulative = TRUE. This will set the upper triangle of the recurrence matrix to0and ensures that the network edges represent recurrent values that have occurred in thepastrelative to the current observed value (node). Ifdirected = FALSEthe argument is ignored (default =TRUE).- doPlot
Plot the multiplex recurrence network (default =
TRUE).- doSave
Save the plots.
- coords
A data frame with layout coordinates generated by calling any of the igraph layout functions. If
NAa circle layout will; be generated (default =NA)- RNnodes
Should the vertices of the MRN represent a plot of the RN of the layers? This is recommended only for a small numbers of vertices. (default = `FALSE“)
- vertexSizeBy
A valid igraph function that calculates node based measures, or a numeric constant. (default =
"degree")- scaleVertexSize
Scale the size of the vertices by setting a range for
ggplot2::scale_size(). This will not affect the numbers on the size legend (default =c(1,6))- vertexColour
A vector of colours for the vertices. If this is a named list, names will be displayed in the legend.
- vertexBorderColour
Draw a border around the vertices. Pass
NULLto use the same colour as the fill colour (default ="black")- showVertexLegend
Show the vertex colour legend?
- showSizeLegend
Should a legend be shown for the size of the nodes? (default =
FALSE)- alphaV
Set transparency for Vertices (default =
1)- scaleEdgeSize
Scale the size of the edges by a constant:
E(g)$width * scaleEdgeSize(default =1/5)- alphaE
Set transparency for Edges. A single numeric, or a vector of length
ecount(g)(default =0.8)- showEdgeColourLegend
Should a legend be shown for the colour of the edges? (default =
FALSE)- curvature
The
curvatureparameter for edges seegeom_curve()(default =-0.7)- title
A title for the plot
- createAnimation
If
createAnimation = TRUEanddoPlot = TRUEand a windowed analysis is conducted, an animation will be produced using either packagegganimate(ifuseImageMagick = FALSE) oranimation(ifuseImageMagick = TRUE). The main difference is thatgganimatehas nice animation transition features, but plots the MRN using ggplot2, which does not have great options for displaying the nodes as images. With packageanimationa sequence of igraph plots will be converted to an animation. IfdoSave = TRUEthe animation will be saved inimageDiras an animated gif by calling eithergganimate::anim_save(), oranimation::saveGIF()(default =FALSE)- useImageMagick
Should ImageMagick be used to create the animation. NOTE: ImageMagick has to be installed on your system, see
animation::saveGIF()(default =FALSE)- loopAnimation
Should the animation loop? (default =
TRUE)`- transitionLength
Length of each transition in the animation, ignored if
useImageMagick = TRUE(default =3)- stateLength
Value of
state_lengthifgganimateis used, or theintervalin seconds foranimation::ani.pause()(default =1)- gifWidth
Width of the animated
gifin pixels. The default width will be600/150 = 4 inor10.16 cm(default =600)- gifRes
Resolution of the animated
gifinppi(default =150)- noParts
Do not plot the individual graphs that make up the animation to the current
dev(default =TRUE)- imageDir
Directory to save the layer images and windowed MRN plots. If
NA, the value returned bygetwd()will be used, ifNULLno windowed images will be saved (default =NA)- silent
Silent-ish mode
Examples
#' # Create some layers
library(igraph)

layers <- list(g1 = igraph::sample_smallworld(1, 100, 5, 0.05),
g2 = igraph::sample_smallworld(1, 100, 5, 0.5),
g3 = igraph::sample_smallworld(1, 100, 5, 1))

mrn_plot(layers = layers,showEdgeColourLegend=TRUE)
#> $MRN
#> $MRN$`window: 1 | start: 1 | stop: 100`

#>
#>
#> $interlayerMI
#> $interlayerMI$`window: 1 | start: 1 | stop: 100`
#>    g1        g2        g3
#> g1 NA 0.8852888 0.9998704
#> g2 NA        NA 1.6162824
#> g3 NA        NA        NA
#>
#>
#> $edgeOverlap
#> NULL
#>
#> $meanValues
#> NULL
#>
#>
#>
#> $interlayerMI
#> $interlayerMI$`window: 1 | start: 1 | stop: 100`
#> g1 g2 g3
#> g1 NA 0.8852888 0.9998704
#> g2 NA NA 1.6162824
#> g3 NA NA NA
#>
#>
#> $edgeOverlap
#> NULL
#>
#> $meanValues
#> NULL
#>
