Plot Multivariate Time Series Data
Usage
plotTS_multi(
  df,
  timeVec = NA,
  groupVec = NA,
  useVarNames = TRUE,
  colOrder = TRUE,
  doPlot = TRUE,
  title = "",
  subtitle = "",
  xlabel = "Time",
  ylabel = "",
  returnPlotData = FALSE,
  useRibbon = FALSE,
  overlap = 1
)
Arguments
- df
A data frame with time series in columns.
- timeVec
If numeric, the number of the column in
dfwhich contains a time keeping variable. IfNA, the time vector will be1:NROW(df)(default =NA)- groupVec
A vector indicating the names of the time series in the columns of
df. IfNA, the column names ofdfwill be used, excluding thetimeVec, if present (default =NA)- useVarNames
Use the column names of
dfas variable names in the Complexity Resonance Diagram (default =TRUE)- colOrder
If
TRUE, the order of the columns indfdetermines the of variables on the y-axis. UseFALSEfor alphabetic/numeric order. UseNAto sort by by mean value of Dynamic Complexity (default =TRUE)- doPlot
If
TRUEshows a Complexity Resonance Diagram of the Dynamic Complexity and returns an invisibleggplot2::ggplot()object. (default =FALSE)- title
A title for the plot.
- subtitle
A subtitle for the plot.
- xlabel
A label for the x-axis.
- ylabel
A label for the y-axis.
- returnPlotData
Return the restructured data frame used to create the plot (default =
FALSE)- useRibbon
Neat for distributions
- overlap
Multiplier for scaling the series around the y-offset. Default is
offset + elascer(y, lo = -.45*overlap, hi = .45*overlap)and ifuseRibbon = TRUEit isoffset + elascer(y, lo = 0*overlap, hi = .95*overlap). (default =1)
Value
A ggplot2::ggplot object.
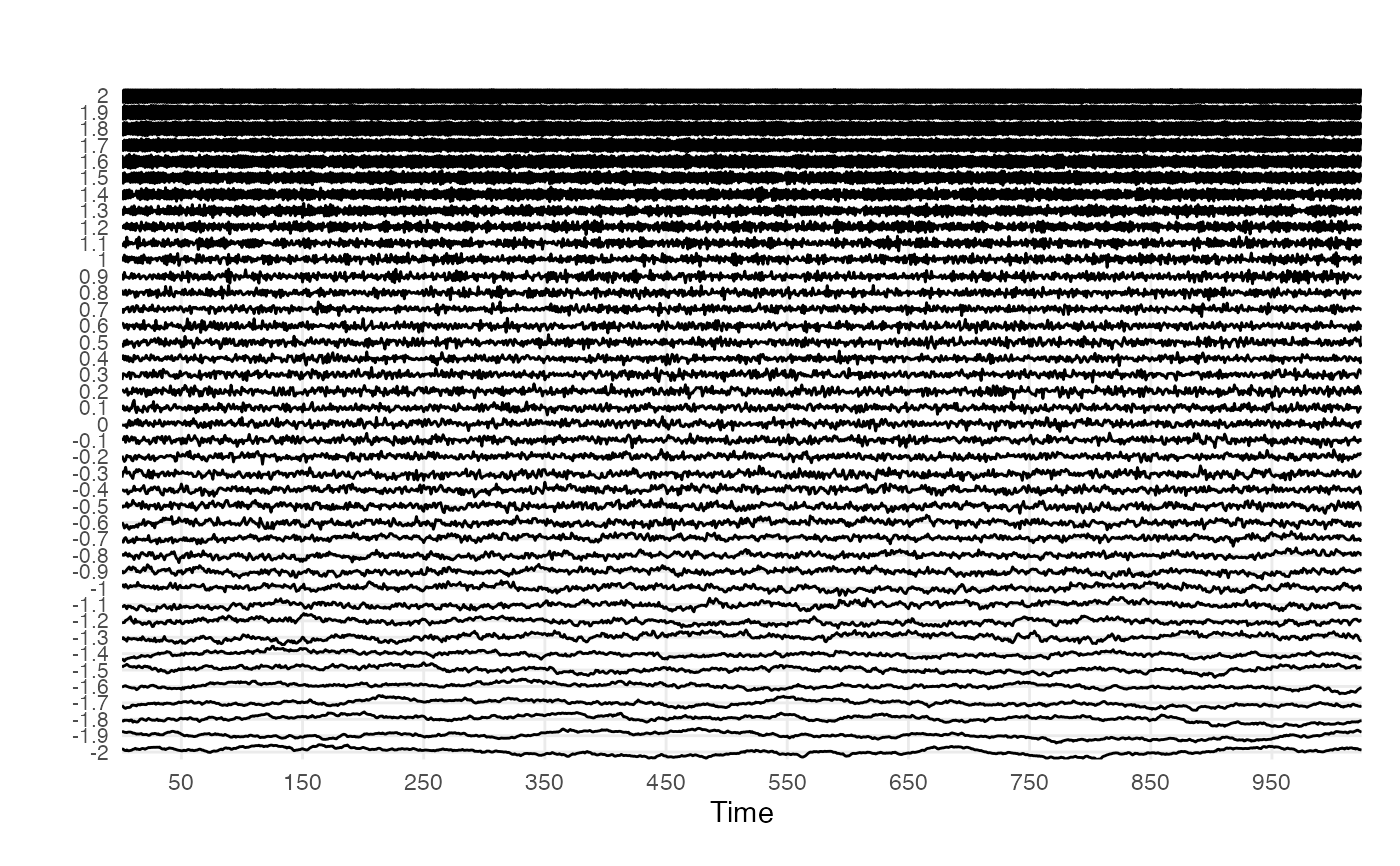
Examples
# Use the coloured noise data set.
data(ColouredNoise)
plotTS_multi(ColouredNoise)