Usage
make_spiral_graph(
  g,
  type = "Archimedean",
  arcs = 6,
  a = 1,
  b = NULL,
  rev = FALSE,
  curvature = -0.6,
  angle = 90,
  markTimeBy = NULL,
  labelSize = 3,
  alphaV = 1,
  alphaE = 0.6,
  showArrows = FALSE,
  title = "",
  subtitle = "",
  showEpochLegend = TRUE,
  markEpochsBy = NULL,
  epochColours = NULL,
  epochLabel = "Epoch",
  showSizeLegend = FALSE,
  sizeLabel = "Size",
  scaleVertexSize = c(1, 6),
  vertexBorderColour = "black",
  scaleEdgeSize = 1/5,
  edgeColourLabel = "Weight",
  showEdgeColourLegend = FALSE,
  edgeColourByEpoch = TRUE,
  defaultEdgeColour = "grey70",
  doPlot = TRUE,
  ggplotReturn = FALSE,
  igraphReturn = FALSE
)
Arguments
- g
An igraph object. If (
rev = FALSE) the vertex with the lowest index will be placed in the centre of the spiral, the highest index will be most outer vertex,- type
Spiral type, one of
"Archimedean","Bernoulli","Fermat", or,"Euler"(default ="Archimedean")- arcs
The number of arcs (half circles/ovals) that make up the spiral (default =
10)- a
Parameter controlling the distance between spiral arms, however, the effect will vary for different spiral types (default =
0.5)- b
Parameter controlling where the spiral originates. A value of 1 will generally place the origin in the center. The default
NULLwill choose a value based on the different spiral types (default =NULL)- rev
If
TRUEthe vertex with the highest index will be placed in the centre of the spiral (default =FALSE)- curvature
The
curvatureparameter for edges seegeom_curve()(default =-0.7)- angle
The
angleparameter for edges seegeom_curve()(default =90)- markTimeBy
Include a vector that indicates time. The time will be displayed on the plot. Pass
TRUEto generate auto labels (experimental)- labelSize
The size of text in the annotation labels (default =
3)- alphaV
Set transparency for Vertices (default =
1)- alphaE
Set transparency for Edges. A single numeric, or a vector of length
ecount(g)(default =0.8)- showArrows
Show arrows at the end of the edges? (default =
FALSE)- title
A title for the plot
- subtitle
A subtitle for the plot
- showEpochLegend
Should a legend be shown for the epoch colours? (default =
TRUE)- markEpochsBy
A vector of length
vcount(g)indicating epochs or groups (default =NULL)- epochColours
A vector of length
vcount(g)with colour codes (default =NULL)- epochLabel
A title for the epoch legend (default =
"Epoch")- showSizeLegend
Should a legend be shown for the size of the nodes? (default =
FALSE)- sizeLabel
Guide label, use it to indicate if
V(g)$sizerepresents some measure, e.g.igraph::degree(), or,igraph::hub_score(),igraph::strength()(default ="Size")- scaleVertexSize
Scale the size of the vertices by setting a range for
ggplot2::scale_size(). This will not affect the numbers on the size legend (default =c(1,6))- vertexBorderColour
Draw a border around the vertices. Pass
NULLto use the same colour as the fill colour (default ="black")- scaleEdgeSize
Scale the size of the edges by a constant:
E(g)$width * scaleEdgeSize(default =1/5)- edgeColourLabel
Use to indicate if
E(g)$colorrepresents color coding based on some property. (default ="Weight")- showEdgeColourLegend
Should a legend be shown for the colour of the edges? (default =
FALSE)- edgeColourByEpoch
Should edges that connect to the same epoch be assigned the epoch colour? This will ignore edge colour info in
E(g)$color. (default =TRUE)- defaultEdgeColour
Colour of edges that do not connect to the same epoch (default =
"grey70")- doPlot
Produce a plot? (default =
TRUE)- ggplotReturn
returns the ggplot object (default =
FALSE)- igraphReturn
returns the intermediate iGraph object. This will not look the same as the final graph, but has most of the attributes, like edge and vertex colors and spiral layout (default =
FALSE)
Note
To keep the igraph object, use the layout function layout_as_spiral() when plotting the graph.
Examples
library(igraph)

g  <- igraph::sample_gnp(200, 1/20)
V(g)$size <- degree(g)
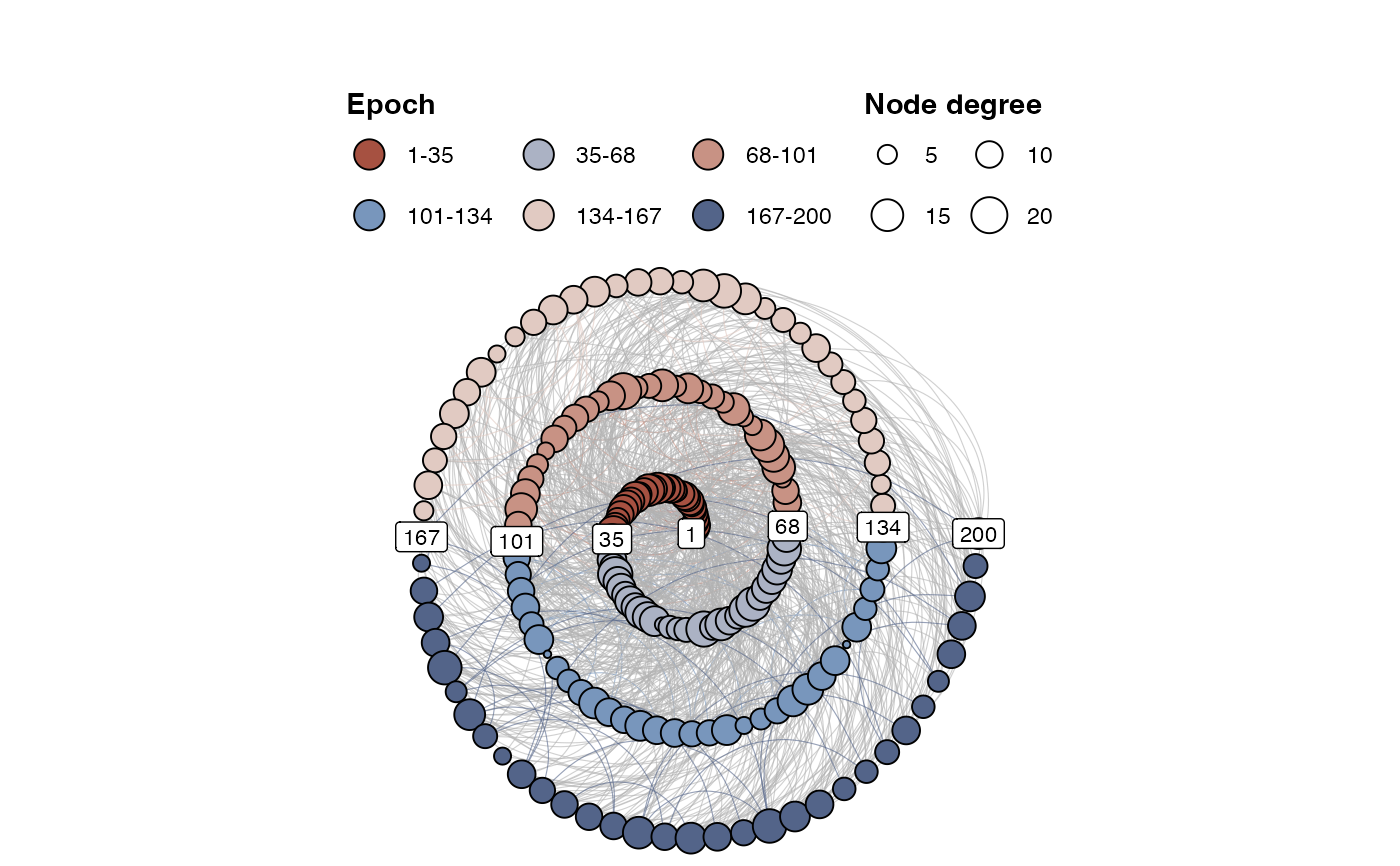
make_spiral_graph(g, markTimeBy = TRUE, showSizeLegend = TRUE, sizeLabel = "Node degree")

