make_spiral_focus(
  g,
  arcs = 6,
  a = 1,
  b = NULL,
  rev = FALSE,
  curvature = -0.6,
  angle = 90,
  markTimeBy = NULL,
  alphaV = 1,
  alphaE = 0.6,
  title = "",
  subtitle = "",
  showEpochLegend = TRUE,
  markEpochsBy = NULL,
  epochColours = NULL,
  epochLabel = "Epoch",
  showSizeLegend = FALSE,
  sizeLabel = "Size",
  scaleVertexSize = c(1, 6),
  vertexBorderColour = "black",
  scaleEdgeSize = 1/5,
  defaultEdgeColour = "grey70",
  doPlot = TRUE
)
Arguments
| g | An igraph object. If ( |
|---|---|
| arcs | The number of arcs (half circles/ovals) that make up the spiral (default = |
| a | Parameter controlling the distance between spiral arms, however, the effect will vary for different spiral types (default = |
| b | Parameter controlling where the spiral originates. A value of 1 will generally place the origin in the center. The default |
| rev | If |
| curvature | The |
| angle | The |
| markTimeBy | Include a vector that indicates time. The time will be displayed on the plot. Pass |
| alphaV | Set transparency for Vertices (default = |
| alphaE | Set transparency for Edges. A single numeric, or a vector of length |
| title | A title for the plot |
| subtitle | A subtitle for the plot |
| showEpochLegend | Should a legend be shown for the epoch colours? (default = |
| markEpochsBy | A vector of length |
| epochColours | A vector of length |
| epochLabel | A title for the epoch legend (default = |
| showSizeLegend | Should a legend be shown for the size of the nodes? (default = |
| sizeLabel | Use to indicate if |
| scaleVertexSize | Scale the size of the vertices by setting a range for |
| vertexBorderColour | Draw a border around the vertices. Pass |
| scaleEdgeSize | Scale the size of the edges by a constant: |
| defaultEdgeColour | Colour of edges that do not connect to the same epoch (default = |
| doPlot | Produce a plot? (default = |
Value
A ggplot object.
Note
To keep the igraph object, use the layout function layout_as_spiral() when plotting the graph.
Examples
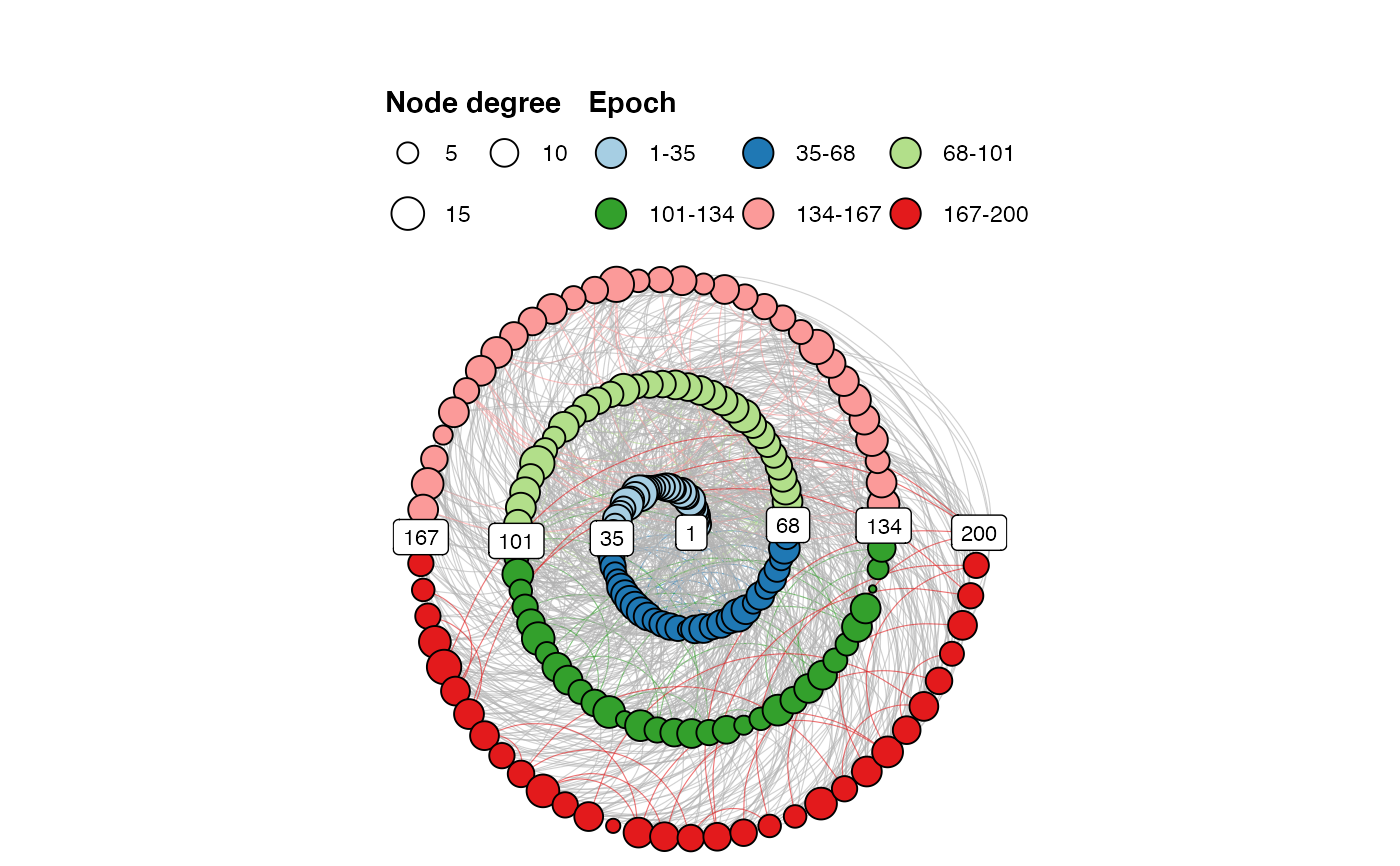
library(igraph)
g  <- sample_gnp(200, 1/20)
V(g)$size <- degree(g)
make_spiral_graph(g, markTimeBy = TRUE, showSizeLegend = TRUE, sizeLabel = "Node degree")